Tracking State-Based Marketplace 2026 Open Enrollment Data: Final Reports
By Emily Zylla, Andrea Stewart, and Jessica Ngoboka / June 5, 2026
Now that the 2026 Marketplace open enrollment period (OEP) has concluded, understanding the state-level impacts of recent federal policy changes is critical. Between the expiration of the enhanced premium tax credits (ePTCs) and significant changes to Marketplace operations, states faced a complex landscape this past year. Stakeholders nationwide are working to understand how these federal changes affected enrollment, consumer behavior, and Marketplace operations, and how they can best prepare for the future policy shifts.
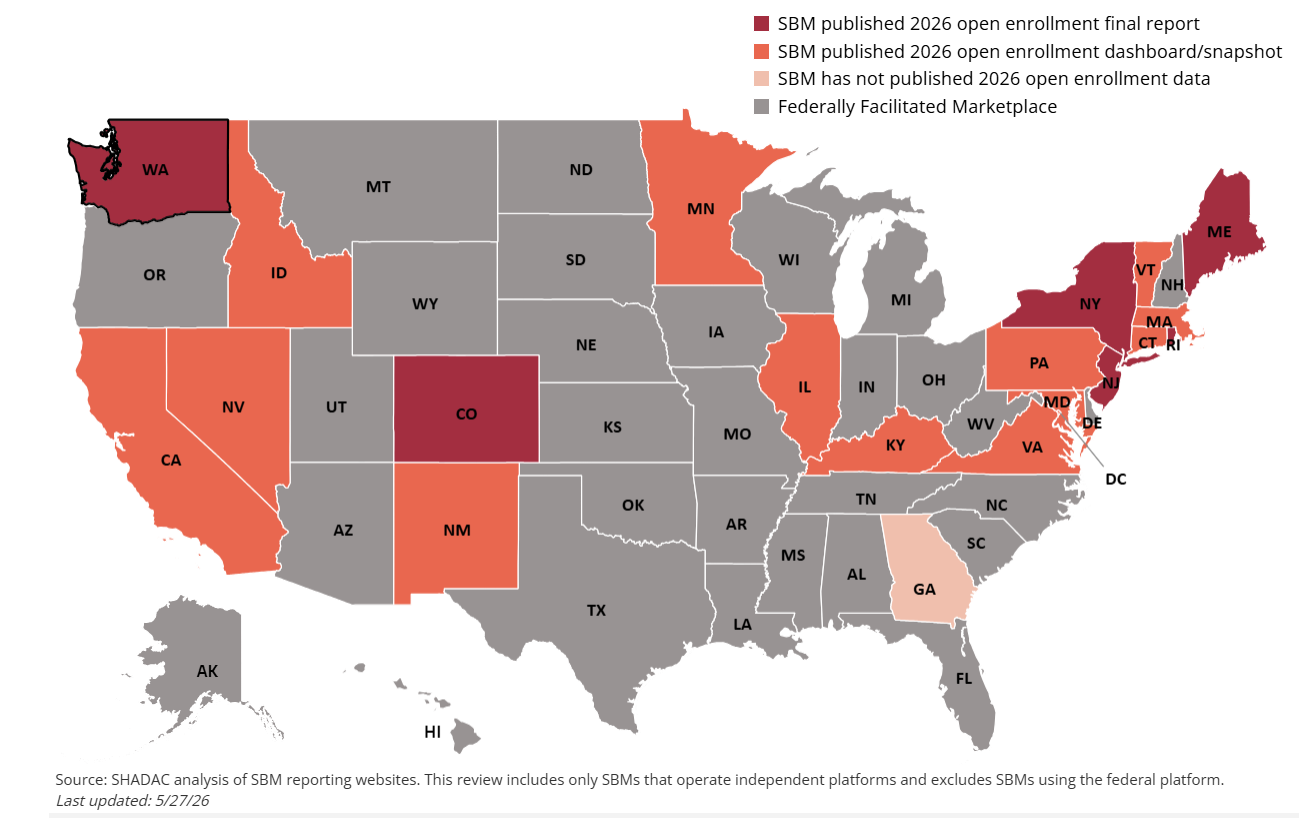
While not all State-Based Marketplaces (SBMs) have released final reports for the 2026 enrollment period, many states have provided other types of data for monitoring Marketplace enrollment trends, including via weekly, bi-weekly, or monthly “snapshots” or data dashboards. For links to more detailed state-level data, the map below serves as a one-stop resource for tracking and accessing all currently published SBM enrollment information. SHADAC will continue to monitor these releases and update the tracker as more final reports become available.
State-Based Marketplace 2026 Open Enrollment Reporting Tracker
While the Centers for Medicare and Medicaid Services (CMS) 2026 Open Enrollment Report provides a standardized national snapshot of enrollment trends across both SBMs and the Federally Facilitated Marketplace (FFM), this aggregate view only captures part of the story. This snapshot reports that plan selections fell by 5% compared to the 2025 OEP, with an 8% decline across states using the HealthCare.gov platform and a 3% increase in states operating an SBM. However, for a more complete picture of what happened and why, final OEP reports published directly by SBMs provide critical primary data that capture the unique local context, challenges, and strategic decisions that shaped the year.
To date, SHADAC has identified six states that have released final 2026 OE reports: Colorado, Maine, New Jersey, New York, Rhode Island, and Washington. In these reports, SBMs are making deliberate choices about the framing of their enrollment data, how they position state-level responses to federal changes, and what data they highlight.
Several key reporting trends and unique measures emerged across this initial cohort of reports:
Framing outcomes around federal policy context. States are grounding their enrollment outcomes in the shifting federal landscape. Nearly all states are opening their reports by pointing to federal policy and operational changes that occurred in 2025 as the primary drivers of market changes, specifically citing the expiration of the ePTCs s, the passage of H.R.1, and the CMS Marketplace Integrity and Affordability Final Rule. For example, Washington’s 2026 report opened with an enrollment highlights section that not only acknowledged the federal policy changes but also summarized and quantified their effects on enrollment and premium costs.
Quantifying the success of state-level solutions. States are also highlighting the localized solutions they put in place to blunt the impact of the expiration of ePTCs, such as lottery programs, premium assistance programs, or state subsidies. For instance, Colorado’s report noted the multiple state-level strategies they implemented to address affordability. This included the establishment of the Colorado Premium Assistance program, which helped offset rising premium costs for over 176,000 Coloradans, including 16,000 young adults who lost federal financial help, and the OmniSalud lottery program which provided financial assistance to another 6,700 customers.
Targeted communications and outreach strategies. States are spotlighting their increased and targeted, communications, marketing, and outreach efforts as critical tools to guiding consumers through a complex and dynamic OEP. Recognizing that confusion and rising costs could deter enrollees, states are reporting relying on proactive, modernized marketing and outreach campaigns to preserve coverage. For example, Maine’s report explicitly highlighted the impression metrics from its 2026 outreach campaign to demonstrate the impact of their marketing methods. They tracked impressions across a variety of delivery methods, including Maine-themed transit advertisements (featuring seasonal lobstering and snowboarding which garnered 4.3 million impressions), community outreach at athletic events, streaming channel ads, and influencer video partnerships.
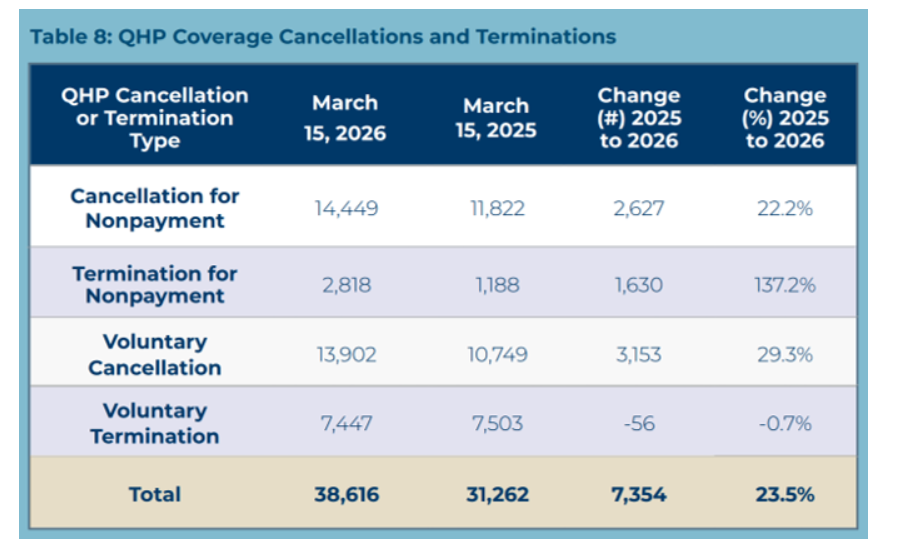
Tracking effectuated enrollment to gauge affordability. While marketplace reports historically have focused on initial plan selections, critical affordability issues in 2026 are prompting states to track how many consumers actually paid their first month’s premium and maintain coverage. Because cancellations and terminations can happen continuously throughout the year, states are increasingly tracking these early effectuation rates compared to previous years to understand how rising costs are impacting retention. For example, reporting in New York showed that even though the state offers a grace period for late payments, cancellation for nonpayment (i.e., coverage never effectuated because the initial premium was missed) rose by 22% in 2026 compared with the same time period in 2025.
Tracking referrals between coverage programs. To understand how new federal policies are shifting consumers between private and public coverage, some states are reporting the number of individuals transferred between Marketplaces and public health coverage. While these metrics track hand-offs rather than final enrollment outcomes, they serve as a critical leading indicator of how affordability is affecting the market as a result of rising private premiums. For example, New Jersey found that around 25,000 more accounts were transferred out from its Marketplace (Get Covered NJ) to Medicaid/the Children’s Health Insurance Program (NJ FamilyCare) than the other way around.
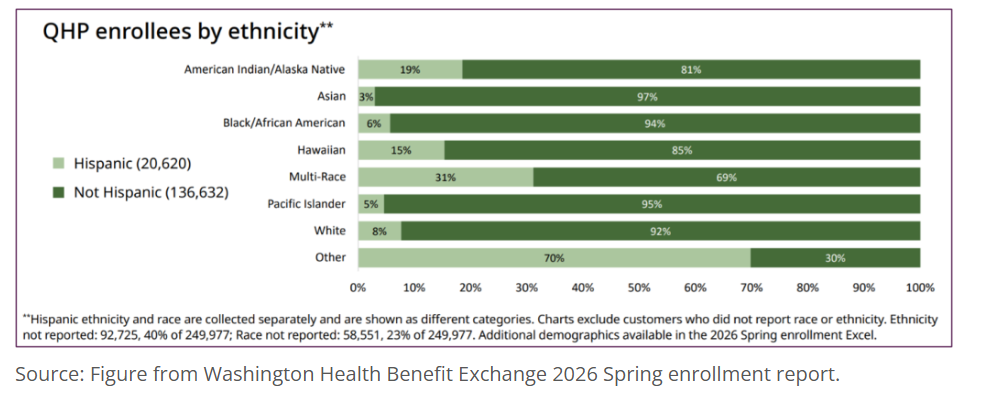
Providing disaggregated consumer data. While most states chose to report certain breakdowns for overall enrollment such as new versus returning customers, age groups, enrollees, county-level data, and plan selection by metal tier, states are also providing more detailed demographic information about their enrollees that provide crucial insight into equity and accessibility. Washington’s report, for example, included enrollment data by income level as a measure of federal poverty level, household size, race and ethnicity, and provided data on the languages most frequently requested by enrollees (Spanish, followed by Chinese) and Apple Health enrollees (Spanish, followed by Russian).